MPS II: Technical profile
Home : Products : Macular Pigment Screener – MPS II : Technical profile
New whitepaper
Products
Free whitepaper
Products
New whitepaper

Blue light whitepaper
The dangers of blue light: what is it and how can we protect against its threat?
Products
New whitepaper

MPS II: Technical profile
The MPS II uses the scientifically-proven technique of heterochromatic flicker photometry (HFP) to measure macular pigment optical density (MPOD), with a choice of two test modes: Standard (central) and Detailed (both central and peripheral).
To monitor the decline or increase of macular pigment over a period of months or years, an MPOD test needs to be accurate and reproducible. We have clinical data which proves the MPS II delivers in this area. The team, led by inventor Professor Ian Murray, designed it with key technological benefits front of mind.
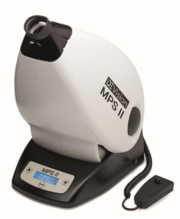
→ Fast, comfortable test format specifically designed for patient comfort
→ Standard test measures MPOD in ~90 seconds per eye
→ Accurate (S.D. ± 0.187 ¹) and reproducible (r = 0.97 ²) estimate of MPOD
→ Light, mobile and electronically stable so regular calibration is not required
→ Software indicates the reliability of MPOD measurement as it is performed
→ Readily operable by all levels of staff
Technical specification | Test modes | FAQs
¹ Ian J. Murray et al, ‘A new desktop instrument for measuring macular pigment optical density based on a novel technique for setting flicker thresholds’, in Ophthalmic & Physiological Optics, Volume 29, Issue 2, pp. 127-137, March 2009.
Heterochromatic flicker photometry (HFP)
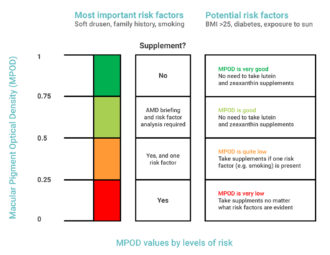
Macular pigment optical density (MPOD) is calculated by measuring how much blue light macular pigment (MP) absorbs. The MPS II uses the principle of heterochromatic flicker photometry (HFP) to provide an accurate calculation of the blue light absorption of MP. MPOD values are provided on a scale of 0-1 – the lower the value, the higher the level of blue light hitting the macula and, therefore, the higher the risk of developing age-related macular degeneration (AMD).
HFP requires patients to make flicker matches using two wavelengths of light, one of which (blue; 465nm) is absorbed by the macular pigment and another (green; 530nm) which is not. Flicker matches are made at both the central and peripheral point in the retina.
The HFP method used by the MPS II obtains flicker matches in a unique way which makes the determination of the minimum flicker point relatively quick and easy, even for inexperienced observers. Patients are instructed to press a button as soon as flicker is detected, in contrast to the more conventional HFP approach where they are required to adjust a green-blue luminance ratio until flicker is minimised or eliminated.
The MPS II uses the principle of HFP in both of its test modes, based on supporting clinical evidence, of which there is a sample below:
- Makridaki M, Carden D and Murray IJ (2009) Macular pigment measurement in clinics: controlling the effect of the ageing media. Ophthalmic & Physiological Optics 29(3), 338-44
- Van der Veen RLP, Berendschot TTJM, Hendrikse F, Carden D, Makridaki M and Murray IJ (2009) A new desktop instrument for measuring macular pigment optical density based on a novel technique for setting flicker thresholds. Ophthalmic & Physiological Optics 29(2)
Note: The MPS II is branded as MPS II QuantifEye in the United States
MPS II test modes
The MPS II has two test modes:
Standard
A central only test estimating MPOD value by comparing result with age normative data ¹
Detailedyi
A central test plus a peripheral test, during which the patient fixates on an offset target. The combination of the two results produces an ‘absolute’ MPOD value. (This option would be used for patients who do not conform to age-normal parameters.)
The expandable sections below are intended to give a clear overview of the way both test modes work. For more detailed information, please see the ‘MPS II’ section of our Clinical data collection or contact us.
¹ Makridaki et al, ‘Macular pigment measurement in clinics: controlling the effect of the ageing media’, in Ophthalmic & Physiological Optics, 2009 29: 338–344.
Step-by-step: Standard mode
Standard, phase 1: flicker sensitivity
The first phase is intended to familiarise patients with the instrument and gauge their flicker response sensitivity, by eliciting five responses to a flickering central target.
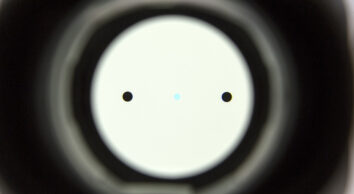
The central target used to determine a patient’s flicker response
The responses allow the MPS II to gauge the appropriate flicker frequency and set the blue/green ratio appropriately for phase 2 of the test.
[Estimated completion time: 30 seconds]
Standard, Phase 2: measurement phase
At this point the central target dims and resets at a slightly different colour, based on the patient’s specific results during phase 1.
As the patient responds to each flickering target at staggered, varying frequencies, the on-screen graph will mark responses as blue squares, moving from left to right as the test progresses and a “best fit” curve will be drawn between the points as they are recorded.
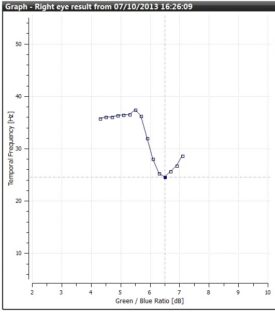
Best fit curve of patient responses in Standard mode.
Ideally, the patient’s plotted graph will follow a downward curve with a clearly defined minimum. Standard mode analysis subsequently calculates the MPOD estimate from the curve minimum and the patient’s age peripheral result.
[Estimated completion time: 60 seconds]
Calculating MPOD value
Once the patient response phases are complete, the data from the responses will be analysed by the MPS II software and the confidence level will be presented on the screen as one of three colour-coded results.
Accept gives you the all-clear that the data is acceptable and the software can determine the minima. Caution tells you that the software can determine a minima but is not happy with the cleanliness of the data and a re-test is advisable. Reject means the test must be retaken as no result can be determined by the patient responses.
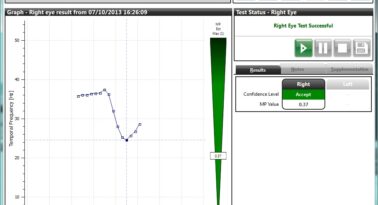
Example accepted MPOD value in Standard mode.
Step-by-step: Detailed mode
Detailed: patient-specific peripheral measurements
The Detailed mode comprises both a central only test (phases 1 and 2 of Standard mode) and a specifically measured peripheral test (as opposed to the age normative calculation used to gauge peripheral results in Standard mode). This option is most suitable for patients who do not conform to age-normal parameters, .e.g. a patient with diabetes, or with any other condition that will contribute to a change in transmission of the ocular lens.
Peripheral phase
The patient fixates peripherally on the red target so they are viewing and responding to the central stimulus in their peripheral vision. With their eye focussed 8° off centre the blue light from the central stimulus passes into the eye at a point where macular pigment is known to be absent.
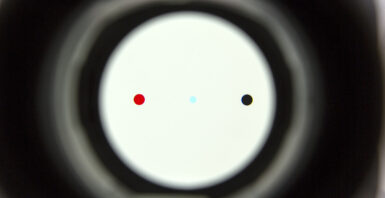
The red fixation target used during the Detailed (peripheral) mode
The results are displayed as red triangles on the same table used to plot the best fit curve during the central only test.
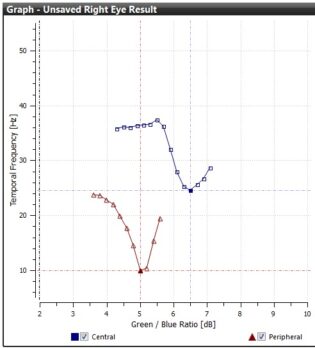
The results for the central and peripheral test in Detailed mode.
Once the test is finished the central and peripheral results are then used to determine the patient’s specific Macular Pigment Optical Density (MPOD) result. This is done by working out the ratio of the amount of blue light absorbed in the central region compared with the peripheral region. The greater the density, the more blue light is absorbed. As with the Standard mode, confidence limits (Accept, Caution, Reject) are displayed along with the MPOD value.
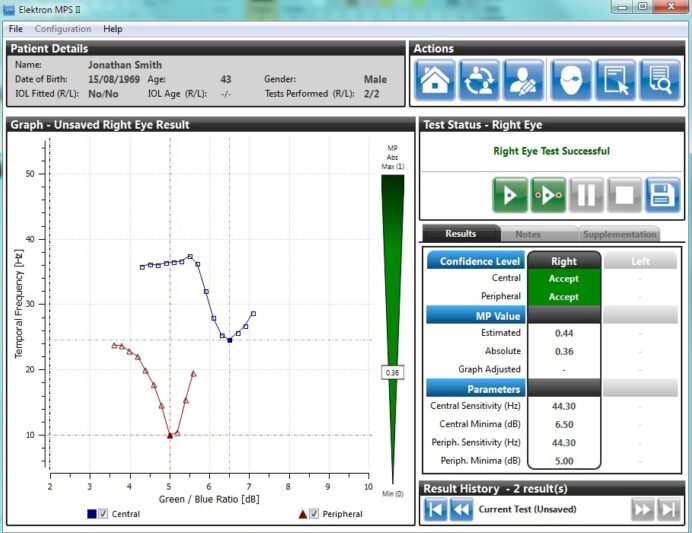
Detailed mode results showing central and peripheral graphs, confidence levels and final MPOD value.
Technical specification
Measuring macular pigment levels to support a proactive, preventative approach to the growing global problem of AMD, the MPS II is
Reliable → scientifically validated through use in multiple studies
Repeatable → has accurately measured more than 4 million eyes
Easy to use → easy-to-use user interface with icon-driven menus
Fast → screen in 90 seconds per eye for efficient patient care
Cost-effective → clear ROI through test fees and supplement sales
Professor Ian Murray
Professor Ian Murray (BSc, MSc, PhD) has worked in Visual Neuroscience for over 20 years. He collaborated with David Carden in the Vision Sciences labs at Manchester University to develop electrophysiological and psychophysical techniques for understanding the human visual system. His work has featured some classical scientific papers on Age Related Macular Degeneration (AMD) and Macular Pigment. He has also published extensively on colour vision, applied techniques for assessing glare whilst driving, measuring optical density and visual reaction times. He has published three books on Vision Science and over 200 peer reviewed papers. Ian has a clinical qualification in Optometry. For details of publications and a flavour of the research breadth see Ian Murray – Google Scholar Citations.
A major thrust of his work was in the development of clinically useful instruments. With Carden, he developed the Macular Pigment Screener which uses a unique technique for obtaining flicker thresholds. The instrument is extremely efficient and is commercially successful. Murray and Carden hold a patent protecting the IP for the technique.
Murray and Carden have also developed a new method for assessing night vision. This instrument helps understand the early stages of AMD. It is also protected by a patent. MuMac Ltd, a new university spin-out company of which Murray and Carden are directors, has been formed to develop the new technique for commercial use in ophthalmic practice .
David Carden
David Carden (BSc MSc Electronics Engineering) is a highly experienced electronics engineer. He worked for many years in industry before becoming Senior Experimental Officer (SEO) at the Vision Sciences Labs, University of Manchester. Whilst at Manchester he published a series of seminal scientific papers that helped to understand the neurophysiological basis of colour vision. Two of these papers, one in Nature, are universally regarded as scientific classics in the field. He has also published two books on how the human visual system works. For further details of his extensive contributions to vision science see David Carden – Google Scholar Citations.
As SEO David worked with Dr Ian Murray to develop the Macular Pigment Screener (MPS II) from a lab-based technique to the successful, commercially available device we are familiar with today. Subsequently, also in collaboration with Murray he has developed a unique method for testing night vision. This instrument will be helpful in understanding the early stages of Age Related Macular Degeneration (AMD). With Murray, he holds international patents to protect both the MPS II and the dark adaptometer.
He is now a director of MuMac Ltd, a new University of Manchester spin-out company. MuMac will develop new techniques for understanding AMD and other pathologies in the ageing eye. His background of electronics, psychophysics and IT is ideally suited for driving the new business forward.
Frequently Asked Questions
What does the MPS II measure and how?
The MPS II uses a novel application of heterochromatic flicker photometry (HFP) to provide an accurate calculation of the blue light absorption of the macular pigment (MP), hereafter referred to as macular pigment optical density (MPOD).
MPOD can be measured using one of the two available test modes:
Standard – a central only test during which the patient presses a button as soon as they detect flicker in a coloured stimulus. This is repeated a number of times until the blue light absorption of the macular pigment has been established. MPOD value is estimated by comparing the patient’s result with age normative data.
Detailed – a central test plus a peripheral test, during which the patient fixates on an offset target. The combination of the two results produces an ‘absolute’ MPOD value. (This option would be used for patients who do not conform to age-normal parameters.)

Best fit curve of patient responses in Standard mode.
Ideally, the patient’s plotted graph will follow a downward curve with a clearly defined minimum. Standard mode analysis subsequently calculates the MPOD estimate from the curve minimum and the patient’s age peripheral result.
[Estimated completion time: 60 seconds]
Calculating MPOD value
Once the patient response phases are complete, the data from the responses will be analysed by the MPS II software and the confidence level will be presented on the screen as one of three colour-coded results.
Accept gives you the all-clear that the data is acceptable and the software can determine the minima. Caution tells you that the software can determine a minima but is not happy with the cleanliness of the data and a re-test is advisable. Reject means the test must be retaken as no result can be determined by the patient responses.

Example accepted MPOD value in Standard mode.
Can I determine MPOD values using only the faster Standard test mode?
The clinical data collected from multiple research studies undertaken with the MPS II /Quantifeye* has allowed MPS II inventor, Dr Ian Murray, to develop an algorithm capable of estimating MPOD based on a foveal (centre-only) measurement**. In instances where a patient’s lens can be considered age normal, the Standard (central only) test can be used with confidence. The Detailed (central plus peripheral) test is only needed to arrive at an absolute value of lens age.
The Detailed test mode will be necessary if a patient has diabetes, or any other condition that can contribute to a change in transmission of the ocular lens. Diabetes is likely to have accelerated a patient’s lens yellowing, meaning that the lens age estimate from the Standard test mode cannot necessarily be relied upon and the result will not be useful for future test comparisons. Should another test be performed 6 months later, for example, it may appear to show an increase in MPOD when this could just have likely been caused by further lens yellowing in the interim.
* Quantifeye is the name under which the MPS II is sold in the United States
** Murray and colleagues used the MPOD values of over 5000 US subjects to develop the centre only measurement. All other MPOD instruments still arrive at MPOD value based on a comparison of foveal and peripheral measurements, only. Such tests take significantly longer to perform.
Relevant clinical data
- Makridaki M, Carden D and Murray IJ (2009) Macular pigment measurement in clinics: controlling the effect of the ageing media. Ophthalmic & Physiological Optics 29(3), 338-44
- Van der Veen RLP, Berendschot TTJM, Hendrikse F, Carden D, Makridaki M and Murray IJ (2009) A new desktop instrument for measuring macular pigment optical density based on a novel technique for setting flicker thresholds. Ophthalmic & Physiological Optics 29(2), 127-137
What is considered a normal MPOD value?
An MPOD of 0.33 is the Western Caucasian average, whilst the Asian average is 0.43. The table below explains at what stage MPOD value might be considered too low.
Relevant clinical data
- Bernstein et al (2010) The value of measurement of macular carotenoid pigment optical densities and distributions in age-related macular degeneration and other retinal disorders. Vision Research 50(7)
- Van der Veen et al (2009) A new desktop instrument for measuring macular pigment optical density based on a novel technique for setting flicker thresholds. Ophthalmic & Physiological Optics 29(2)
- Wooten, B.R., Hammond, B.R (2002) Macular pigment: influences on visual acuity and visibility. Progress in retinal and eye research 21(2)
Do both eyes need to be monitored?
With new patients, it is advisable to test both eyes, with the result from the eye with the lowest score being used to determine the patient’s MPOD value and the basis for future discussion.
What are the optimum conditions for MPOD screening?
The test should be performed somewhere the patient is not distracted. Ambient lighting is not a concern as the background illumination in the MPS II is set at a moderately high level making it brighter than normal ambient lighting.
Are patients with high myopia able to perform the test?
This shouldn’t be a problem as patients can wear their own refractive correction or correction lenses can be slotted into the MPS II eyepiece.
As the test requires patients to respond to flicker rather than a sharply defined shape, patients with high myopia should be fine as long as they can see the stimulus.
A patient does not need dilation to perform an MPS II test but does it matter if they are dilated after other procedures?
While the dilation may make the test more difficult for the patient, it will not affect the HFP response and therefore the result.
Can the patient wear their own glasses / lenses while performing the test?
Yes, as long as they are not blue light filtering as it will affect the test result.
What IOL age should I enter at the beginning of a test?
IOL age as standard is 26 years. The MPS II software will use this as the default unless an alternative age for the lens is selected from the dropdown menu.
As applicable, it is advisable to double-check a patient’s IOL age prior to testing, particularly as age-matched IOL are now available – meaning a 70-year-old patient, for instance, could receive an IOL of an equivalent age. If this was the case, the default IOL age would need to be over-ridden with the actual IOL age for the MPOD reading to be accurate.
Please note: the IOL age is not the age of the patient when the IOL was fitted but is a measure of its blue light absorption which increases with age.
Can patients with cataract(s) be tested?
The test will be near impossible for patients with advanced cataracts as their central vision is usually seriously compromised and the cataract absorbs a lot of blue light, just like macular pigment. However, if the cataract is sufficiently large then a reading can be done viably by ensuring both the standard and the detailed tests are performed.
What about the validation of the MPOD? How does the MPS II compare to reference methods?
It is validated against all other methods and compares favourably, with particularly strong correlation between Heterochromatic Flicker Photometry (HFP) and Two-Wavelength Autofluorescence (r=0.73 at 1.75° from the centre of the fovea)¹.
The process of MPOD measurement used by the MPS II /Quantifeye* has been proven to be both accurate and repeatable in clinical studies against other methods.
* Quantifeye is the name under which the MPS II is sold in the United States
¹ Canovas et al, Comparison between Macular Pigment Optical Density Measurements Using Two-Wavelength Autofluorescence and Heterochromatic Flicker Photometry Techniques. Investigate Ophthalmology and Visual Science 51(6) 3152-56
The MPS II uses blue light – is this safe?
Yes. The blue light is at safe levels and only used for a short period of time.
Is there clinical data supporting the taking of lutein/zeaxanthin supplements to raise MPOD?
Yes, a growing number. Here is a selection of them:
- Age-Related Eye Disease Research Study (AREDS) 2 – Results (2013)
- Davis, R.L. (2016) Preliminary Results in Macular Pigment Optical Density Associated with and without Zeaxanthin and Lutein Supplementation. Advances in Ophthalmology & Visual System 2(6)
- Delcourt et al (2006) Plasma Lutein and Zeaxanthin and Other Carotenoids as Modifiable Risk Factors for Age-Related Maculopathy and Cataract: The POLA Study. Clinical and Epidemiologic Research, Volume 47
- Richer et al (2012) Macular Re-pigmentation Enhances Driving Vision in Elderly Adult Males with Macular Degeneration. Clinical & Experimental Ophthalmology 3(3)
Whilst many others are available on the MPS 9001 clinical data webpage here.
